Standardize and manage custom visuals as data assets in Nextmv alongside your model. Accelerate your workflows with interactive charts, plots, and maps that automatically render alongside run details for streamlined analysis and collaboration.

Whether you’re visualizing routes on a map or tracking inventory fluctuations in a scatter plot, now you can visualize it all in Nextmv for smarter workflows and enhanced transparency. It’s easier to interpret model output with the storytelling capabilities of custom visuals in context with the run details like input data, model version, and logs. Collaborate with operators, business users, and other stakeholders by sharing links to interactive visuals that surface the data they need to make informed planning decisions.
Nextmv supports popular visualization tools such as Plotly, Chart.js, and GeoJSON. Below are a handful of examples of the many different types of interactive charts, graphs, and other visualizations that you can attach to your decision model workflow on Nextmv:
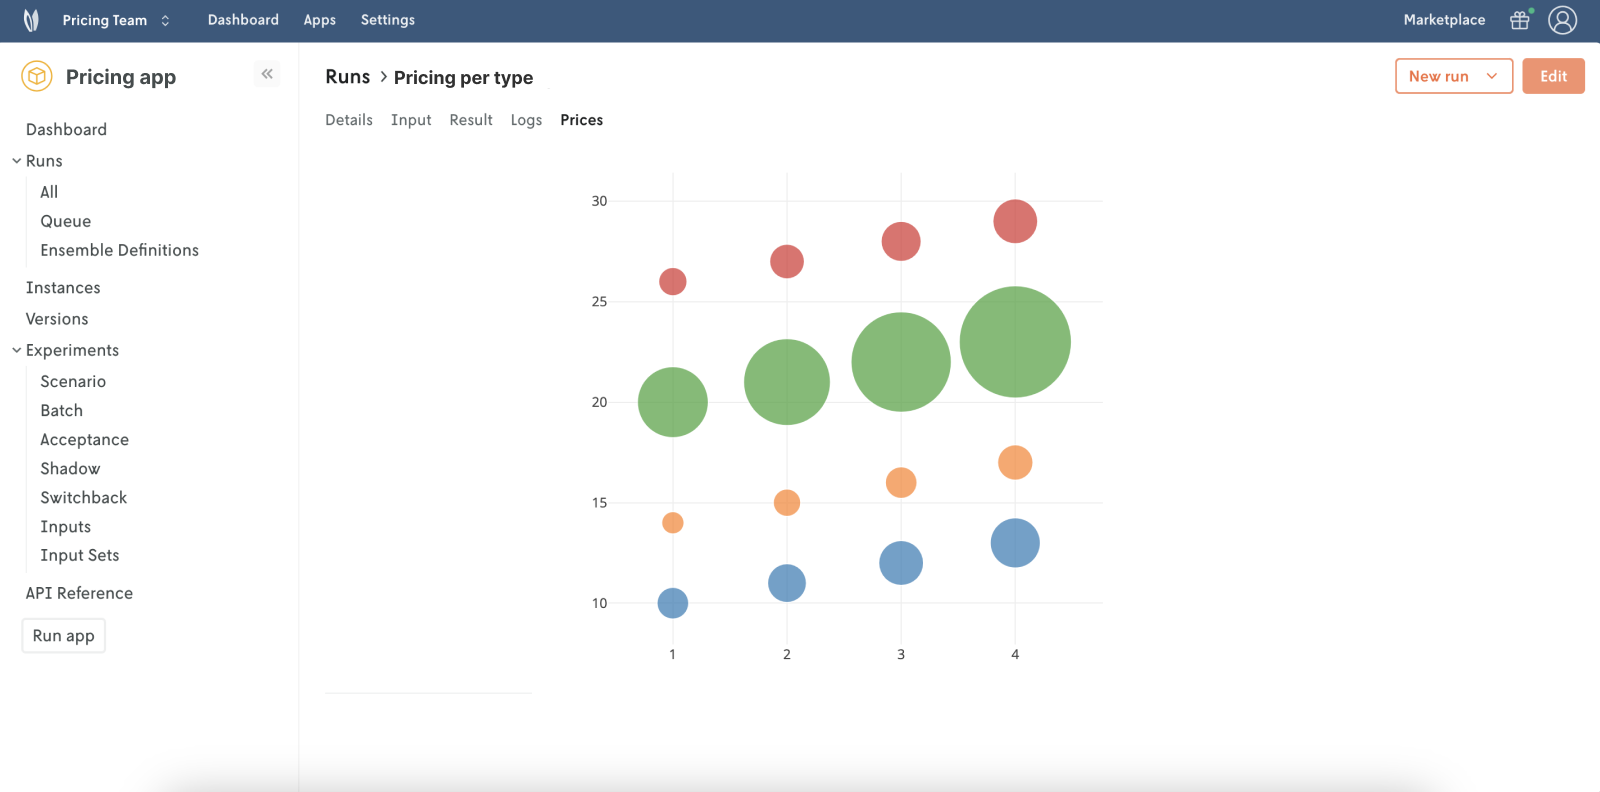
Plotly bubble chart with size scaling

Plotly candlestick chart
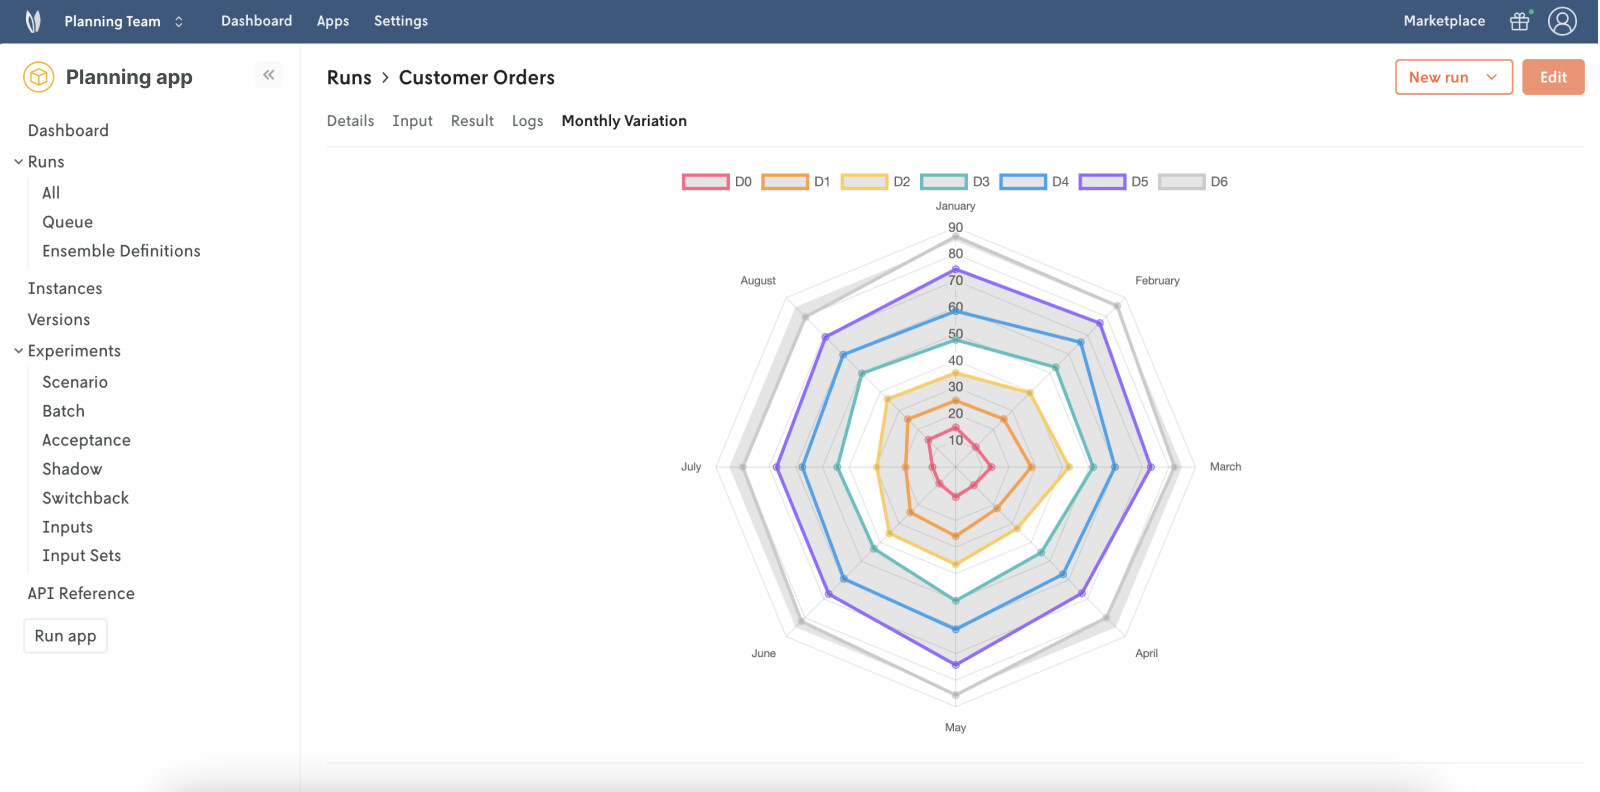
Chart.js radar chart

Chart.js bubble chart

GeoJSON map with clustering
Render your visualizations automatically
Optimization projects can lose momentum when it’s time-consuming to manage scripts and organize output data sets, run them, and distribute the resulting visualizations to varying teams. Integrating shareable, interactive visualizations as part of your automated workflows can save you time and accelerate decision model rollout.
Automatically create and attach your custom visualization to every model run. Instead of running scripts manually to report on results each time you run your model, include the visualization code with your model so it renders in the Nextmv UI as part of each run. Simply extend your model code by adding “assets” to the output. When you do, you’ll generate an associated visualization with every run of your decision app on Nextmv.

Example model code to add a custom visualization
Your custom visualization renders alongside all of your other run data such as input, results, and logs.

GeoJSON map of routes